FAO MRV

ENERGY Sector GHG Inventory

Energy

Power, Transport, and Industry are three major sub-sectors under the Energy Sector, while Brick manufacturing, Residential and commercial buildings (energy use), Energy use in Agriculture activities (pumps, tractors, harvesters etc.), and fish farms, F-gases (HCFC use) in air conditioning and refrigeration and Fugitive emission from the gas transmission and distribution systems, flaring in oil/ gas fields etc. are considered as other sub-sectors of the Energy Sector.  Energy Sector accounts for 76.33% of total emissions (Source: Overview of Bangladesh’s NDC at COP26, 2021). The highest contribution (24.91% of the total) of GHG emission is found for the Industry (energy) subsector followed by Power (23.24% of the total) and Transport (8.86% of the total) under the Energy Sector. In the unconditional scenario, 26.3 Mt CO2e (95.4%) of this emission reduction will be from the Energy sector.

The Energy Sector held the highest contribution to the total GHG emission at 93.09 Mt CO2e or 55.07% of the total emission in 2012. BAU scenario by 2030 is projected to be 312.54 Mt CO2e (76.34% of the total) in the Energy sector

Reports
arrow-icon

Emission Estimates - Energy Sector

Total emission from energy sector CO2e Gg
1.A.3 - Transport (total)
1.A.2 - Manufacturing Industries and Construction
A.1.a.i - Electricity Generation
CO2 Emission from Residential, Agricultural & Commercial Sectors
Contribution of different categories on energy sector's emission (%)
Table
arrow-icon

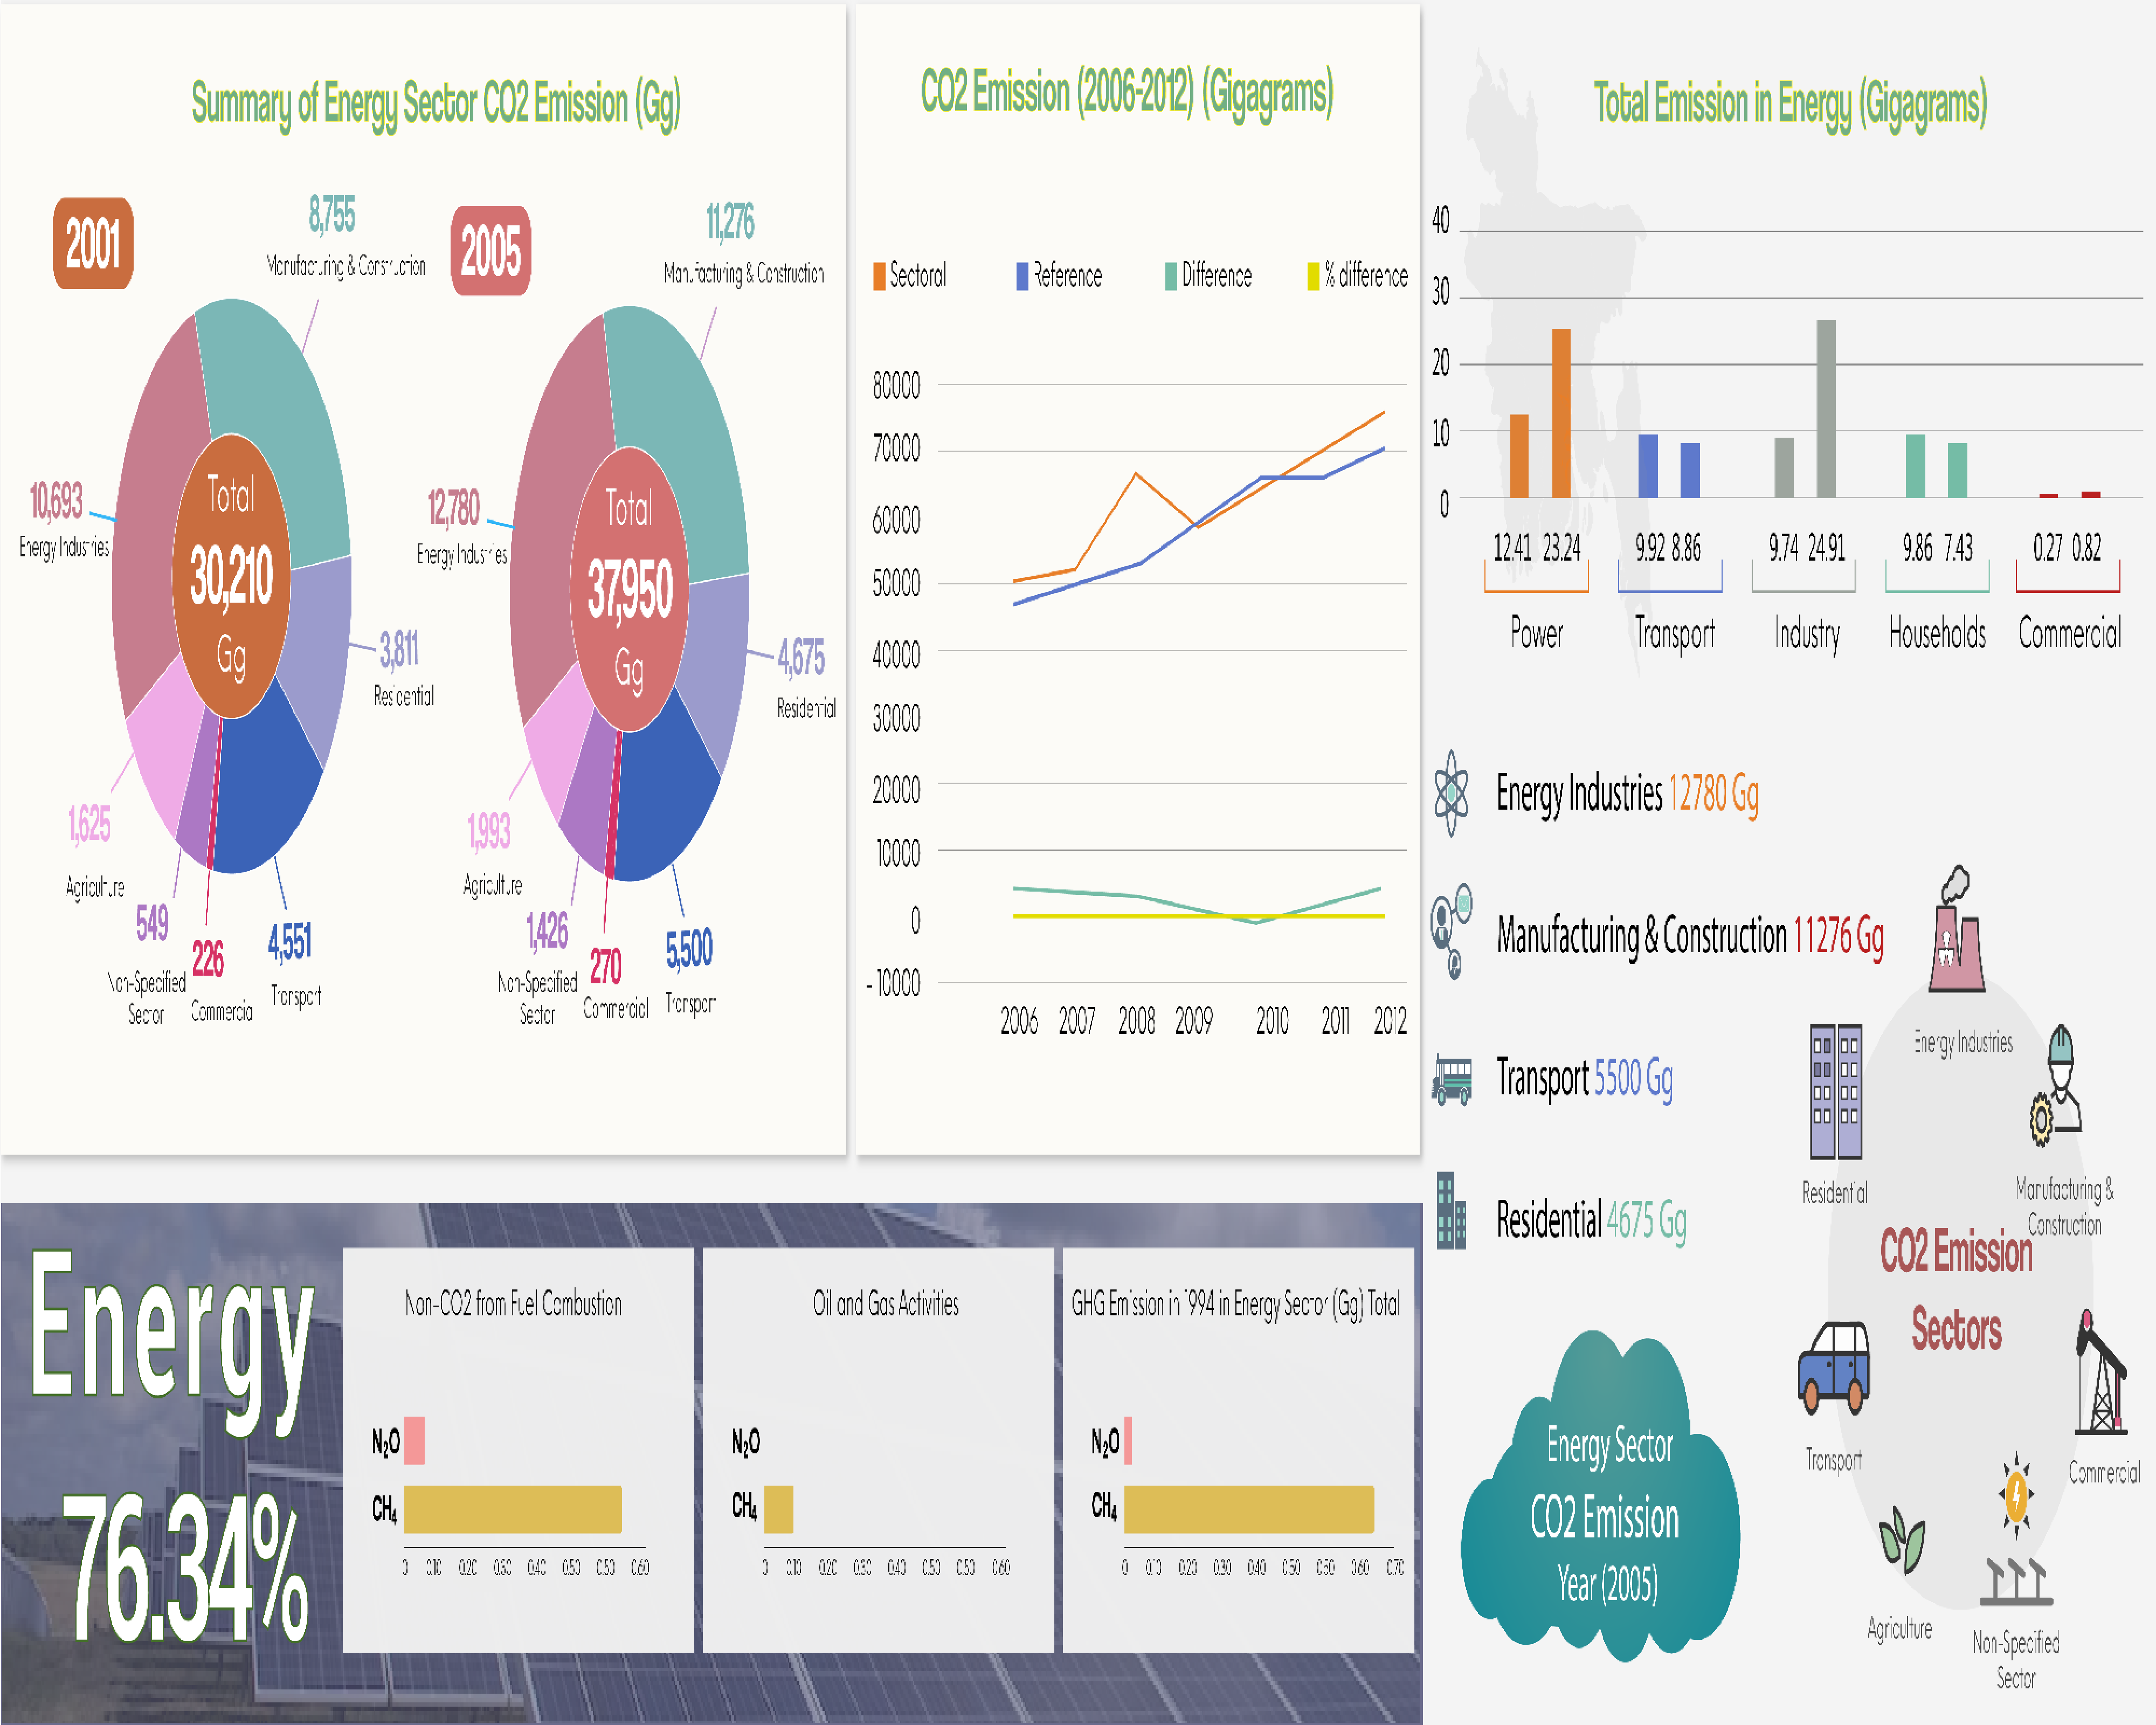
Emission Estimates - Summary of energy sectors emission estimates

Greenhouse emission from Energy consuming sectors (CO2e Gg)

  2019 2018 2017 2016 2015 2014 2013 Contribution of different categories on energy sector's emission (%)
1.A.1.a.i - Electricity Generation 46735 46346 44155 42038 37746 34958 32714 40.54
1.A.2 - Manufacturing Industries and Construction 26888 25947 25241 24402 23148 22435 20835 23.32
1.A.3 - Transport (total) 19845 16264 15864 14018 13576 13554 12472 17.21
1.A.3.a.ii-Domestic Aviation 938 890 822 757 738 704 694
1.A.3.b.i.2 - Passenger cars without 3-way catalysts 2440 2019 1962 1710 1708 1485 1450
1.A.3.b.ii.2 - Light-duty trucks without 3-way catalysts 1985 1410 1298 1215 1135 1030 914
1.A.3.b.iii - Heavy-duty trucks and buses 12682 10320 10201 9082 8960 8504 8126
1.A.3.b.iv - Motorcycles 1232 1152 1136 1089 1030 979 934
1.A.3.c - Railways 168 156 140 117 115 115 113
1.A.3.d.ii - Domestic Water borne Navigation 401 350 332 289 208 196 162
1.A.4.a - Commercial/Institutional  835 833 981 1260 1522 1619 1871 0.72
1.A.4.b - Residential 12317 11355 9702 9755 8573 6960 6703 10.68
1.A.4.c - Agriculture/Forestry/ Fishing/Fish Farms 3452 3502 2909 3040 2983 2809 2697 2.99
1.B-Fugitive emissions from fuels (total) 5185 7325 7325 9336 9336 9336 9336 4.49
1.B.2.b.iii.4- Transmission and Storage (Fugitive) 896 896 896 896 896 896 896
1.B.2.b.iii.5- Distribution (Fugitive) 4289 6429 6429 8440 8440 8440 8440
Total emission from energy sector CO2e Gg 115257 111572 105338 104224 97326 90589 87732
Methodology

AFOLU Sector Methodology 001

AFOLU Sector Methodology 003

Click the link below for Emission
Estimates Data :

AFOLU Sector Methodology 001

AFOLU Sector Methodology 003

FAO MRV