FAO MRV

AFOLU Sector GHG Inventory

Agriculture, Forestry & Other Land Use

Agriculture, Forestry and Other Land Use (AFOLU)

The AFOLU sub-sector (agriculture) covers methane emission from cultivated rice fields, nitrous oxide emission from nitrogen-based fertilizer, methane emission from enteric fermentation of livestock and methane and emission from manure management. The AFOLU (forestry) sub-sector covers emissions from forest areas and carbon stock in Bangladesh. The current GHG emission of this sector is 13.44% (Source: Overview of Bangladesh’s NDC at COP26, 2021). In the AFOLU sector, BAU is prepared following rice cropping area and livestock population projection for 2030 from relevant Ministries and agencies; Forestry related emission is taken from Bangladesh’s Forest Reference Level (FRL) and kept constant. No mitigation scenario analysis was carried out for Other Land Use.

For the base year, total GHG emission accounts for 169.05 million tons CO2 equivalent (MtCO2e). The Agriculture sub-sector under the AFOLU Sector generates the highest 45.87 MtCO2e, about 27.13% of the total GHG emission for the base scenario. According to IPCC guidelines for the Forestry sub-sector, Bangladesh has established a Forest Reference Level (FRL) for the historical reference period 2000-2015. The estimated emission from the forestry sector is 1.19 MtCO2e/year, and the estimated removal is 0.81 MtCO2e/year. The net change, FRL, is 0.37 MtCO2e/year. Waste and IPPU Sector generates 24.11 and 5.61 MtCO2e emission respectively

Reports
arrow-icon

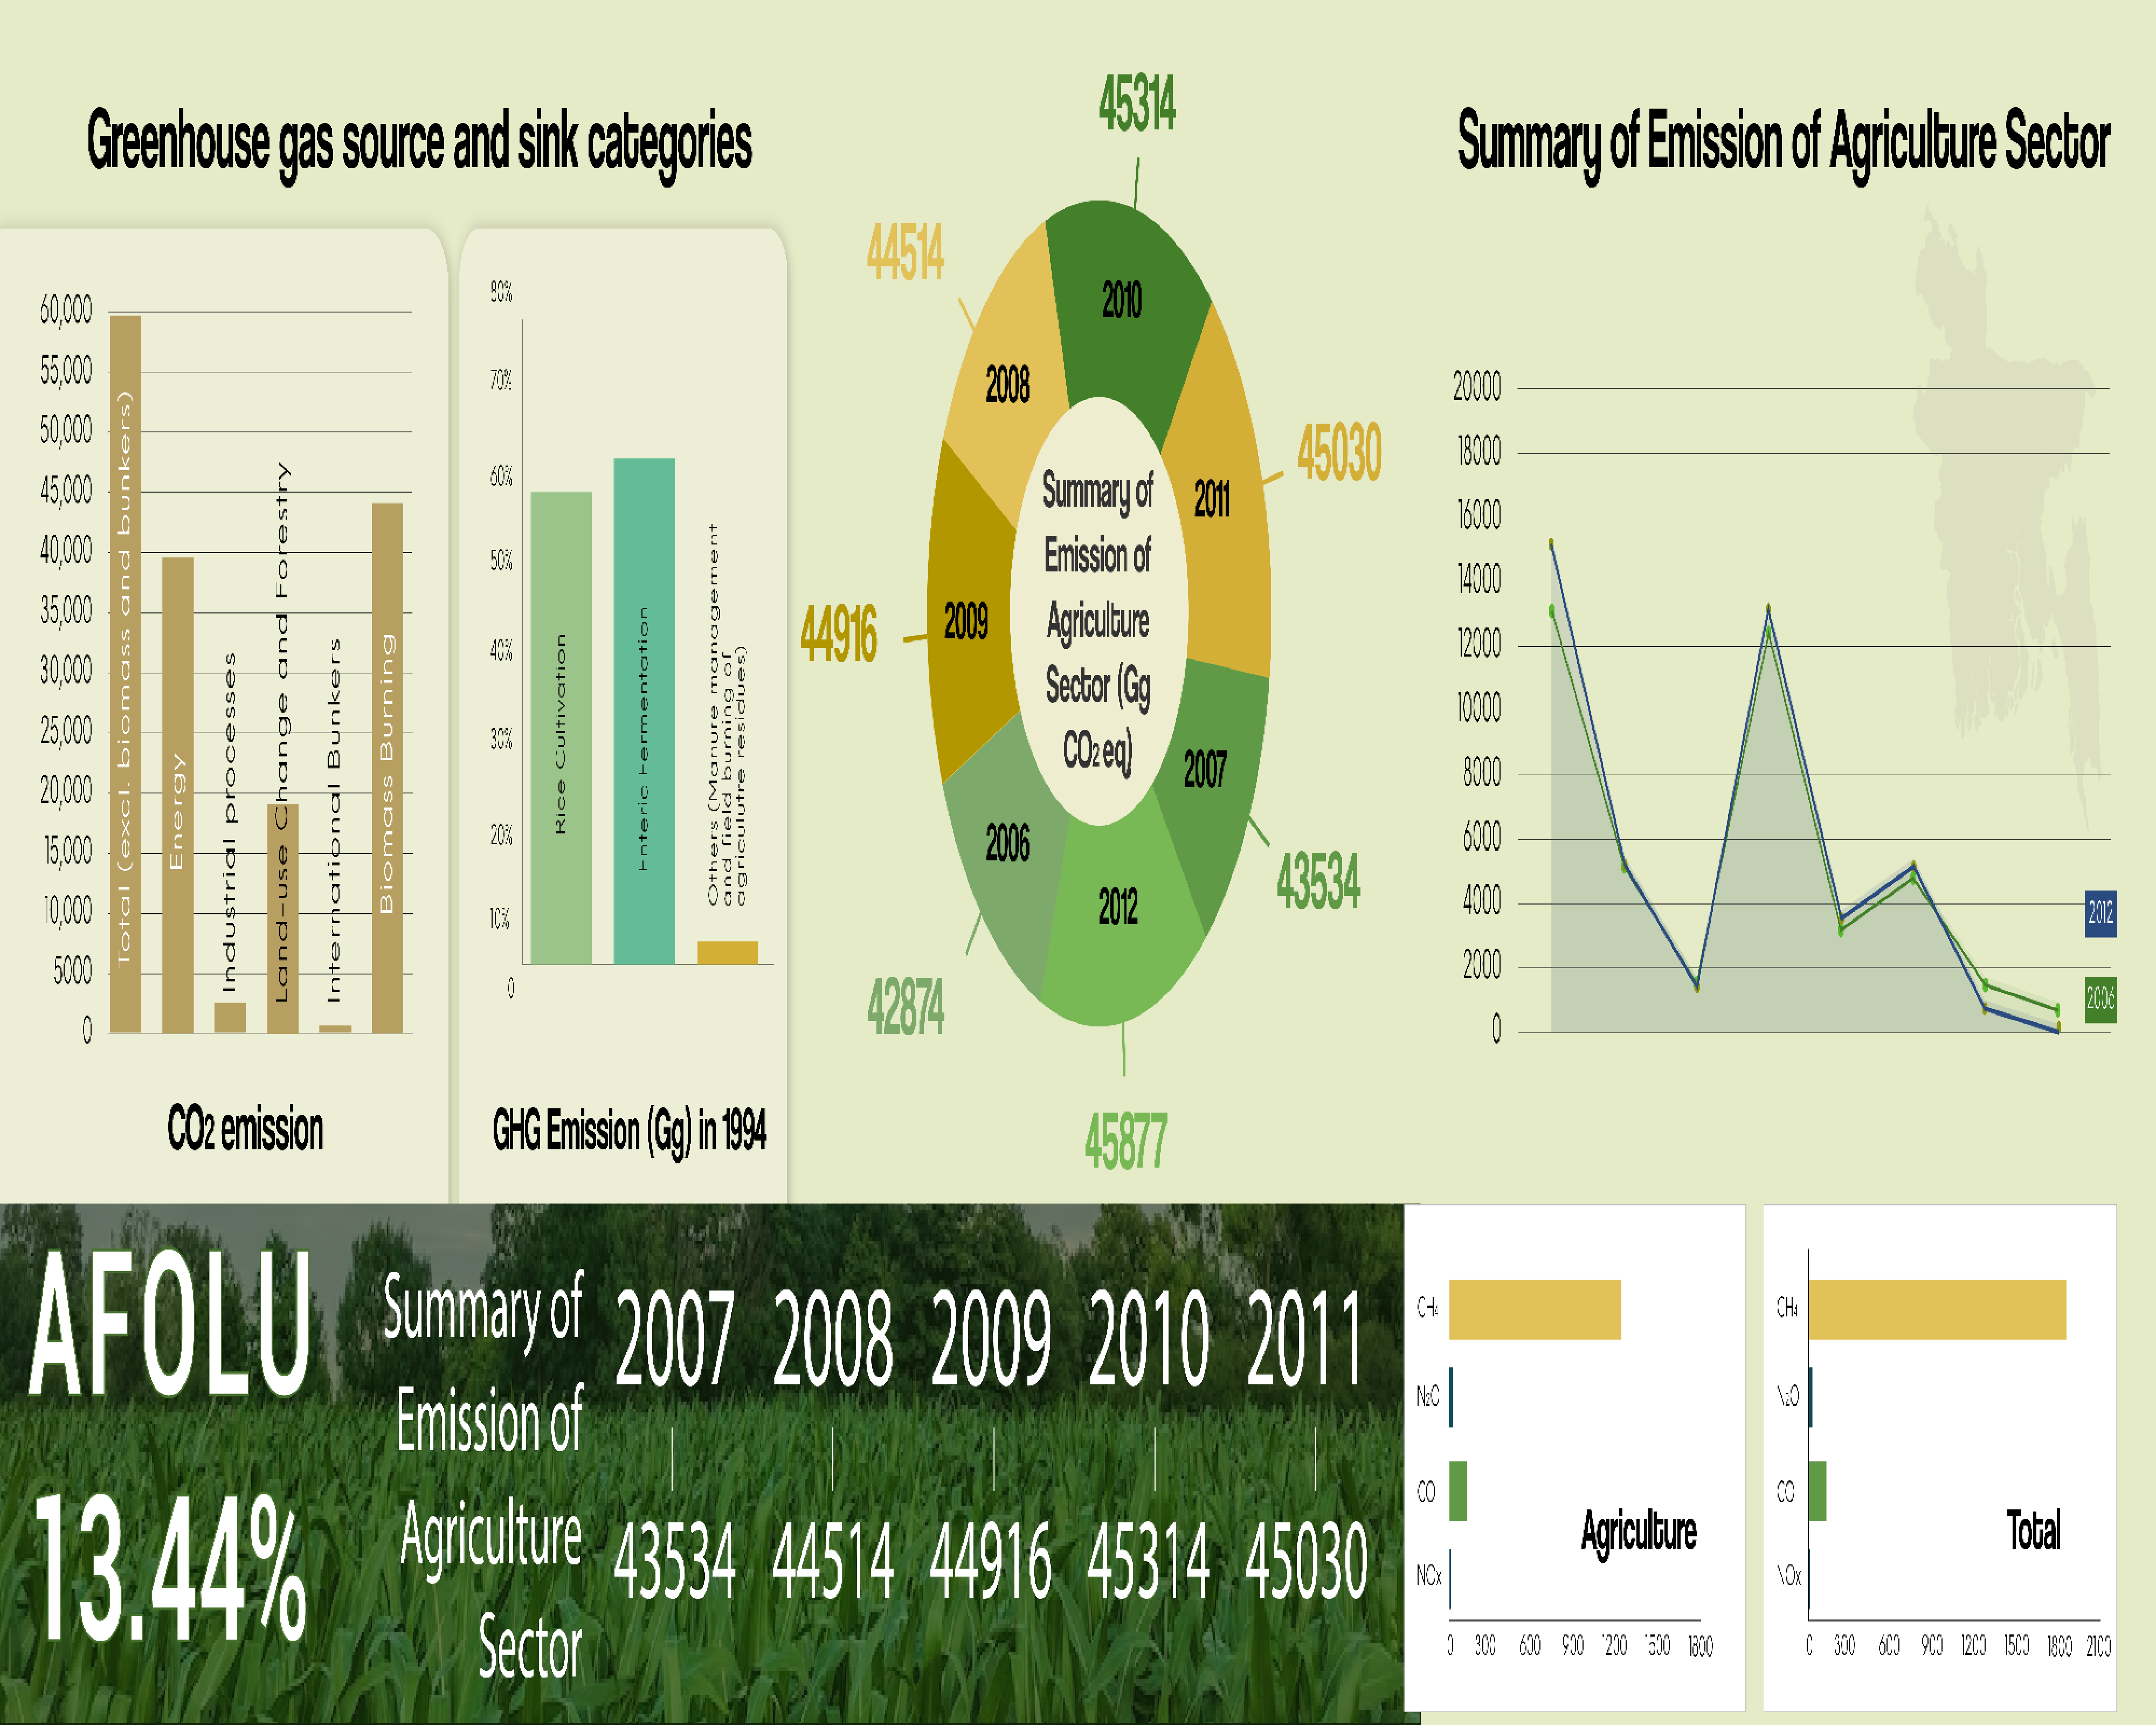
Emission Estimates - AFOLU

3.C.7-Methene emission from rice cultivation
3.a-Total emission from livestock (CO2e Gg)
Total emission from AFOLU sector (CO2e Gg)
Contribution of different categories on AFOLU sector's emission (%)
Table
arrow-icon

Emission Estimates - Summary of AFOLU sectors emission estimates

Greenhouse emission from AFOLU sectors (CO2e Gg)

  2019 2018 2017 2016 2015 2014 2013 Contribution of different categories on waste sector's emission (%)
3-Total emission from agriculture (CO2e Gg) 61864.1 61675.5 60285.1 61875.9 61407.8 60474.8 60157.9
3.a-Total emission from livestock (CO2e Gg) 30225.1 30030.5 29843.1 29650.9 29458.8 29267.8 29080.9 41.61
3.a.1-Methene emission from enteric fermentation (CO2e Gg) 27764.1 27588.5 27419.1 27244.9 27071.8 26898.8 26728.9
Dairy Cattle 10544 10477 10412 10346 10282 10217 10153
Other Cattle 11452 11381 11309 11238 11168 11098 11029
Buffalo 2043 2034 2032 2023 2013 2003 1994
Sheep 442.1 433.5 425.1 416.9 408.8 400.8 392.9
Goat 3283 3263 3241 3221 3200 3180 3160
3-Total emission from agriculture (CO2e Gg) 61875.9 61864.1 61675.5 61407.8 60474.8 60285.1 60157.9
3.b-Emission from Forestry and other land use-FOLU (CO2e Gg) 10769.6 10159.59 9526.19 8465 7810.58 7038.17 6232.92 14.82
3.c-Aggregate sources and non-CO2 emissions sources on land (CO2e Gg) 32225 31949 31645 31639 31207 31077 30442 43.55
3.C.3-Direct Nitrous oxide emissions from urea application 2053 1980 1907 1885 1870 1833 1833
3.C.4-Direct Nitrous oxide emissions from managed soils (N Based Fertilizers) 6490 6259 6132 5985 5878 5816 5773
3.C.5-Indirect nitrous oxide emissions from atmospheric N deposition and leaching/runoff 2096 2020 1966 1931 1897 1863 1863
3.C.6-Indirect nitrous oxide emissions from manure management 6432 6376 6323 6258 6214 6162 6099
3.C.7-Methene emission from rice cultivation 15520 15476 15435 15385 15328 15239 14607
Total emission from AFOLU sector (CO2e Gg) 72633.7 71835.09 70340.9 69811.29 69218.38 67512.97 66390.82
Methodology

AFOLU Sector Methodology 001

AFOLU Sector Methodology 003

Click the link below for Emission
Estimates Data :

AFOLU Sector Methodology 001

AFOLU Sector Methodology 003

FAO MRV